
The Switchgear Audit: Finding Hidden Heat Before the Breaker Trips
Industry: Manufacturing & Electrical Maintenance | Product: DP Series Handheld Thermal Imager (640×512) | Application: Electrical Cabinet Thermal Fault Detection
The Problem: You Can't See Heat — Until Something Burns
It was 2:47 AM at a 200,000-square-foot automotive components plant in central China. The night shift was running at full output when the main distribution panel in Building B tripped without warning. The entire production line — stamping presses, robotic welders, conveyor systems — went dark. The backup generator kicked in 40 seconds later, but the damage was done: 12 welding robots lost their program positions, a heat-treat furnace cooling cycle was interrupted, and 400 partially-machined parts had to be scrapped.
Root cause investigation revealed a loosened bus bar connection in the main panel. The lug had been slowly heating for weeks — resistance rising, heat building, insulation degrading — until the thermal finally cascaded into a fault. The charred insulation around the connection told the story: this had been a problem long before the breaker tripped.
Total cost of the incident: ¥340,000 in scrapped materials, restarted furnace cycles, emergency electrician call-out fees, and 6 hours of lost production. And it was the third unplanned electrical failure in 14 months.
The plant had been doing monthly visual inspections of all panels. Thermographers from a third-party service company came in twice a year. But between those visits, the panels were closed, energized, and opaque. Nobody could see what was happening inside.
We were inspecting the outside of a locked box and calling it an inspection. The heat was in there the whole time — we just didn't have eyes that could see it.
— Electrical Maintenance Supervisor, Automotive Components Plant
The Shift: From Visual Inspection to Thermal Transparency
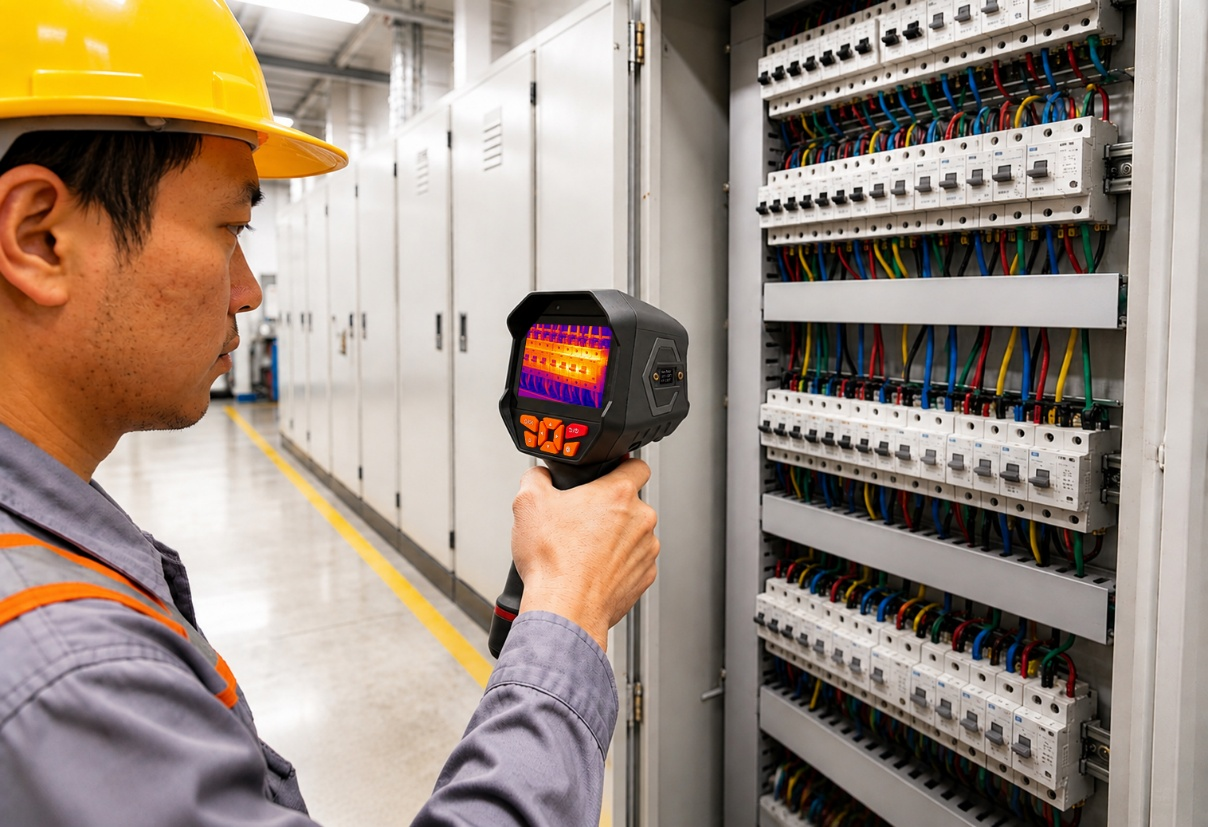
The plant's electrical engineering team proposed a weekly thermal scanning program for all 87 distribution panels, motor control centers (MCCs), and switchgear cabinets across the facility. The tool they selected: a 640×512 resolution handheld thermal imager from the Dianyang DP series.
Why 640×512 and not 384×288? The decision came down to what was inside the cabinets. An electrical panel is not a single target — it's a dense field of components: main breakers, branch breakers, contactors, overload relays, bus bars, terminal blocks, and neutral bars, many spaced only 20–30 mm apart. At the typical scan distance of 0.5–1.0 meter with the panel door open, 384×288 provides roughly 1.0–1.5 mm per pixel — enough to see that "something in the top section is hot," but not enough to confidently distinguish whether the heat is coming from the lug, the bus bar, or the breaker terminal immediately next to it.
The 640×512 sensor, at the same distance, delivers approximately 0.6–0.9 mm per pixel. That difference is the difference between "row 3 is warm" and "the C-phase lug on the 200A main breaker is 18°C hotter than the adjacent A and B phases." In electrical troubleshooting, that specificity is everything. You need to know exactly which connection to tighten, which breaker to replace, and which circuit to de-energize — before you open the panel.
The Program: The Open-Door Sweep, Every Wednesday
The team built a structured routine that fit into a single morning:
Step 1 — Panel Inventory and Baseline Imaging
Before scanning for problems, they imaged every panel under normal load conditions. Each cabinet got a thermal baseline: a reference image showing the expected temperature distribution across breakers, bus bars, and terminal blocks at typical operating load.
- Phase A / B / C breaker terminal temperatures (°C)
- Bus bar connection temperatures at top and bottom (°C)
- Neutral bar temperature (°C)
- Ambient temperature inside cabinet (°C)
- Load current per phase at time of baseline (A)
Step 2 — The Wednesday Morning Sweep
Every Wednesday at 7:00 AM, before the day shift ramped up to full load, one electrician walked the facility with the DP series thermal imager. Each panel took 2–3 minutes: open the door, scan left to right, top to bottom, capture two images (wide and zoomed), compare to baseline, close the door, move on. No shutdown. No de-energization. No contact. The entire sweep of 87 panels took about 3 hours.
Step 3 — Alert Thresholds and Escalation
They established clear action thresholds based on temperature rise above baseline and phase-to-phase differential — the two metrics that matter most in electrical work.
|
Alert Level |
Condition |
Action |
|
Green |
All terminations within ±5°C of baseline; phase differential < 8°C |
Continue weekly sweep |
|
Yellow |
Any termination 6–15°C above baseline, or phase differential 8–20°C |
Schedule tightening/replacement within 7 days |
|
Red |
Any termination > 15°C above baseline, or phase differential > 20°C, or any point > 90°C |
Immediate investigation; consider load transfer or planned shutdown |
Three Catches That Prevented the Next Blackout
Catch #1 — The Loosened Lug (Week 2)
The main distribution panel in Building B — the same panel that had failed months earlier — showed a C-phase lug temperature of 82°C, up from a baseline of 66°C. The A and B phases were at 64°C and 66°C respectively. The 16°C phase differential was a classic signature of a loosening connection. A torque check confirmed: the lug had backed off to 18 N·m, well below the specified 35 N·m.
Action: Retorqued during a 20-minute planned production gap. Lug temperature returned to baseline within 48 hours.
Cost avoided: ~¥340,000 (estimated repeat of the original incident)
Catch #2 — The Overloaded Branch Breaker (Week 5)
A 63A branch breaker in the Building C MCC was reading 74°C on the load-side terminal — 22°C above its baseline of 52°C. The other breakers on the same row were all within 3°C of baseline. The 640×512 image clearly isolated the heat to the terminal screw, not the breaker body — ruling out an overload and pointing to a high-resistance connection.
Action: Terminal cleaned and re-landed during the lunch break. Temperature dropped to 54°C by the next sweep.
Cost avoided: ~¥45,000 (estimated breaker failure + localized outage)
Catch #3 — The Harmonic-Heated Neutral Bar (Week 9)
The neutral bar in a panel feeding a bank of variable-frequency drives (VFDs) was reading 78°C — 26°C above its baseline. This was not a loose connection; the entire neutral bar was uniformly hot. The pattern was unmistakable: triplen harmonics from the VFDs were accumulating on the neutral conductor, causing continuous heating. The 640×512's wide field of view captured the full neutral bar in one image, making the uniform heating pattern immediately obvious compared to the adjacent, cooler phase bars.
Action: Oversized neutral conductor installed during the next planned shutdown. Neutral bar temperature dropped to 58°C. The electrical team also initiated a harmonic study for the VFD-fed panels.
Cost avoided: ~¥120,000 (estimated neutral conductor failure + potential fire risk)
The Numbers After Six Months
|
Metric |
Before Thermal Program |
After 6 Months |
|
Unplanned electrical failures |
3 per year |
0 |
|
Emergency electrician call-outs |
8 per quarter |
2 per quarter |
|
Average repair cost per incident |
¥180,000 |
¥12,000 |
|
Panels inspected per week |
0 (visual only) |
87 (thermal) |
|
Total electrical maintenance cost/quarter |
¥210,000 |
¥68,000 |
|
Production downtime from electrical faults |
41 hours/quarter |
3 hours/quarter |
Downtime from electrical faults: down 93%. The 640×512 thermal imager paid for itself in the first month — twice over.
Why 640×512 Was the Right Choice
The team evaluated 256×192, 384×288, and 640×512 before committing. Here's how the decision broke down for electrical cabinet inspection:
|
Factor |
256×192 |
384×288 |
640×512 |
|
IFOV at 0.8m |
~2.5 mm/px |
~1.5 mm/px |
~0.8 mm/px |
|
Distinguish adjacent breakers? |
No — blends together |
Partially — some merging |
Yes — clear separation |
|
Identify specific lug vs. bus bar? |
No |
Difficult at <30mm spacing |
Yes — reliable |
|
Phase-to-phase differential visible? |
Rough estimate only |
Usable but imprecise |
Yes — precise |
|
Needed for this application? |
Insufficient |
Marginal for dense panels |
Optimal |
For electrical cabinets — where components sit centimeters apart and the diagnostic question is always "which exact connection is hot" — 640×512 isn't a luxury. It's the minimum resolution that turns a thermal image from a warning sign into a work order.
Before, we opened a panel and hoped nothing was wrong. Now we open it already knowing exactly which lug to check. The thermal image is our x-ray before the surgery.
— Electrical Maintenance Supervisor, Automotive Components Plant